 |
||||||||
One hundred twenty seven schools responded to the survey developed by VIP and sent out by DOE. The survey was intended to find information about physics numbers in high schools. It inquired as to teacher education, certification and years of experience. It asked question concerning the “level” of physics and as to what math pre and co-requisites exist for those classes. I will provide a brief overview of the findings here. I will handout a summary of the results at the spring VIP meeting. The survey should give the reader a feel for the “state” of physics teaching in Virginia. All mistakes, errors, and unreasonable conclusions are entirely my own. Thanks to all who completed and returned the surveys and to everyone who helped to create the survey, special thanks to Delores Dalton, DOE Science Supervisor, for mailing out and receiving the surveys.
All
school sizes noted, on the average, an increase in population. There was,
however, great variance between individual schools, some with growth and
some with reduced population. Both
the larger schools and the mid-sized schools noted an average increase
over the last three years of about 120 students.
The smaller schools had a proportionately much smaller rate of
growth. Trends
in teacher experience and background are rather interesting.
The average teacher of physics has 15 years of experience with
10 years of experience teaching physics.
On the average teachers in the smaller schools had more experience,
more years experience in teaching physics, and were more likely to be
certified in physics than their colleagues in middle or large sized high
schools. Teachers in middle sized schools had more
experience but were equally likely to be certified as those in larger
schools. 81% of all teachers
teaching physics were certified.
This rate was 93% in smaller schools, 80% in middle sized schools
and 79% in larger schools. Physics
teachers in larger schools were somewhat more likely to have a degree
in physics or engineering. 60%
of all physics teachers have such a degree (this includes BS, MS, MA or
Ph.D. in physics, physics education, or engineering). Much
greater differences can be observed when the courses being offered are
examined. The most common physics course being offered
in the schools answering the survey is “Physics Alg/Trig”. 93% of all schools offer this course.
98% of the large schools, 91 % of the middle schools and 93% of
the small schools offer a course at this level. There is a very small,
probably negligible, growth in this level across the state. The notable differences show up in other levels offered. “Physics Concepts” a course
described on the survey as containing little or no math is offered by
33% of the larger schools, but by less than 10% of small and middle sized
schools. The “Physics
Concepts” and “Physics Limited Math” is where there
appears to be a lot of growth. Schools
report adding, on the average, just under 1.5 sections of each of these
courses over the last 3 years. Other
areas of significant growth appear in IB Physics course offerings and
Astronomy. This growth probably represents new courses
being offered. These courses
are only offered in a minority of schools, fewer than 10% offer astronomy
and less than 5% IB. IB Physics
is being offered in a few mid and large sized schools but not in the smaller
schools. Whereas, Astronomy is fairly equally represented in mid and large
schools but more common in the smaller schools. While some individual schools showed decreased enrollment in
some courses offered, the overall trend is towards growth. Data
concerning course co- and pre- requisites is rather confusing.
I can conclude that different schools have very different policies. Some teachers included comments that their
school will not prohibit any student from taking a class based on what
classes they may have or not have taken.
With respect to the Alg/Trig based Physics course there is more
agreement about pre- requisites than for other courses. When you examine this part of the data,
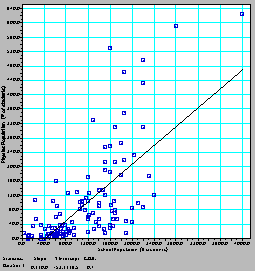
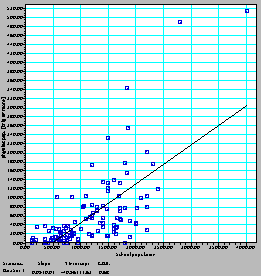
refer to the survey for the number codes for the pre- and co- requisites. The next two pages are graphs of # of Physics students vs. School Population. I have included all schools on the graphs. This includes Governor’s and magnet schools. I have fit a regression line to the data with full awareness that the data does not show a strong correlation. There are obviously many factors that determine what percent of a school population takes physics. I present the graphs and the other data as a way for us to reflect upon ourselves and to look for areas of growth and opportunity. I
hope you can find some aspect of this data useful. Regards,
|
 |
A special thanks to VASTfor hosting our web site. |
|