The Play Doh™
Resistor
By Thomas O'Neill
o'neill@csvrgs.k12.va.us
C. Shenandoah Valley R. Governor's School
Objectives:
- The student will demonstrate knowledge of the
relationship between length of a wire and resistance of a wire by
experimentally determining that relationship using an Volt-Ohm
meter.
- The student will demonstrate knowledge of the
relationship between cross-sectional area of a wire and resistance
of a wire by experimentally determining that relationship using an
Volt-Ohm meter.
Virginia Standards of Learning: (revised 1988)
Third grade: 3.3, 3.4, 3.5
Fourth grade: 4.4, 4.7
Sixth grade: 6.2
Eighth grade: 8.1, 8.4, 8.9, 8.11,
Twelfth grade: 12.1, 12.3, 12.11, 12.16
Scope, Sequence and Coordination of Secondary School Science
from The Content Core , Vol. 1 (1993). The National
Science Teachers Association. Washington, DC.
Grades 6-8
Electricity and magnetism -Electric circuits (pg. 102 and pg.
108-9) Grades 9-10
Electricity and magnetism -Moving charge
(pg. 101 and pg. 115)
Grades 11-12
Electricity and magnets - Electric circuits (pg. 102 and pg.
123)
Project 2061
from Benchmarks for Science Literacy (1993) American
Association for the Advancement of Science. Washington, DC.
The Nature of Science: The Scientific World View (1A pp.
5-7)
Kindergarten through Grade 2
Grades 3 through 5
The Nature of Science: Scientific Inquiry (1B pp. 10-13)
Kindergarten through Grade 2
Grades 3 through 5
Grades 6 through 8
Grades 9 through 12
The Physical Setting: Forces of Nature (4G pp. 94-97)
Kindergarten through Grade 2
Grades 3 through 5
Grades 6 through 8
Grades 9 through 12
Equipment and materials:
- Play Doh™ modeling compound from
Playskool, Inc., Pawtucket, RI 02682 (available at most toy and
department stores)
- Volt Ohm Meter (VOM) alternatively use a known
resistance, a galvanometer, a wire with meter stick and a
Wheatstone bridge set-up alternatively use voltmeter/ammeter
method of determining resistance.
References:
- Carpenter, Rae and Minnix, Richard. The
Dick and Rae Physics Demo Notebook. Dick and Rae, Inc. 1993
pg. E-380
- Jones, Brian. ‘Resistance Measurements in
Play-Doh™’. The Physics Teacher 31:1 (Jan.
1993) pp. 48-49
Construction of equipment:
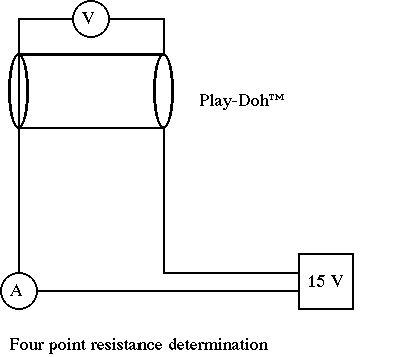
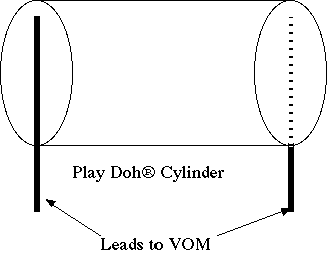
The Play Doh™ should be fresh and
not dried out. Shape the material into a cylinder. Set up the
voltmeter and ammeter as diagramed below: The power should be
supplied by a 0-15 V laboratory DC source. The voltmeter should be
connected across the ends of the Play-Doh™ and not the leads
of the power supply as chemical reactions at the interface of
electrode and Play-Doh™ will rapidly change the character of
those ends.
Alternatively, with a good VOM it is possible to measure the
resistance directly although the numbers will vary considerably
and will not be consistent with the Volt/Ammeter method. Small
fissures in the Play-Doh™ will have large effects on the
internal resistance of the cylinder. It is usually best to plot
only the results from one run (constantly increasing the length)
as the resistance of the cylinder seems to depend on the presence
or absence of cracks in the Play Doh™ as it is rolled
out.


Suggested activities:
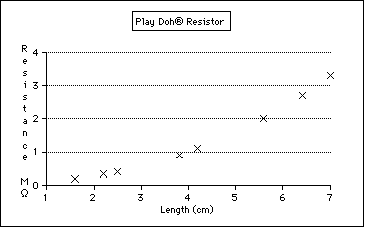
1) Measure the resistance of the Play Doh® for
various lengths using the same amount of compound each time.
The general equation for the resistance of a wire is

where R is the resistance, r is the resistivity
and is characteristic of a given material (usually in Ohm -cm),
length is the length of the wire in centimeters, and area is the
cross sectional area of the wire in square centimeters. Since the
volume of the cylinder in question is constant and
Volume = Area *(length)
then substituting in the equation above we
get
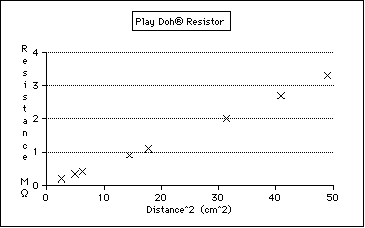
![Formula: Resistance=([(rho)(length^2)]/(Volume)](HOME4.GIF) where
both r and V are constants. This means that a plot of resistance
versus the length2 should be a straight line. The following is a
typical data plot:
where
both r and V are constants. This means that a plot of resistance
versus the length2 should be a straight line. The following is a
typical data plot:


Back to the Teaching Ideas Page
Back to the Virginia Instructors of
Physics Home Page.
This page was posted on 2/26/99