The Electronic
Cricket
By Thomas O'Neill
o'neill@csvrgs.k12.va.us
C. Shenandoah Valley R. Governor's School
Objectives:
- The student will demonstrate knowledge of thermistors and the
effect of heat on resistance by plotting the chirps (or flashes)
versus temperature and determining the linear relationship.
- The student will demonstrate knowledge of temperature by using
the electronic cricket to measure the temperature of hot, warm,
cool and cold water .
- Supplemental (if students construct their own device)
- The student will demonstrate knowledge of circuit diagrams by
constructing an electronic device.
Virginia Standards of Learning: (revised 1988)
Third grade: 3.3, 3.4, 3.5
Fourth grade: 4.4, 4.7
Sixth grade: 6.2
Eighth grade: 8.1, 8.4, 8.9, 8.11
Twelfth grade: 12.1, 12.3, 12.11, 12.16, 12.17
Scope, Sequence and Coordination of Secondary School Science
from The Content Core , Vol. 1 (1993). The National
Science Teachers Association. Washington, DC.
Grades 6-8
Energy - thermal (pg. 101 and pg. 105)
Electricity and magnetism - electric circuits (pg. 102 and pg.
107-9)
Grades 9-10
Energy -transformations (pg. 101 and pg. 106)
Electricity and magnetism - electric circuits (pg. 102 and pg.
107-9)
Grades 11-12
Electric circuits (parallel) (pg. 102 and pg. 109)
Project 2061
from Benchmarks for Science Literacy (1993) American
Association for the Advancement of Science. Washington, DC.
The Nature of Science: The Scientific World View (1A pp. 5-7)
Kindergarten through Grade 2
Grades 3 through 5
The Nature of Science: Scientific Inquiry (1B pp. 10-13)
Kindergarten through Grade 2
Grades 3 through 5
Grades 6 through 8
Grades 9 through 12
The Physical Setting: Forces of Nature (4G pp. 94-97)
Kindergarten through Grade 2
Grades 3 through 5
Grades 6 through 8
Grades 9 through 12
Equipment and materials:
- thermistor (Radio Shack 271 -110 $1.99)
- 9 volt battery
- 10 ½ resistor (Radio Shack 271 -1301 $0.10)
- 2.2 K½ resistor (Radio Shack 271 -1325 $0.10)
- 100 µF capacitor (Radio Shack 271 -1016 $0.99)
- 555 Dual Timer IC (Radio Shack 276-1723 $1.19)
with 8 pin IC Socket (Radio Shack 276 -1995 $0.30)
- 8 ½ Speaker or LED (Radio Shack 276 -041 $0.50)
- Wire (solid 18 or 20 or 22 gauge)
- Dual IC Board (Radio Shack 276 -158 $1.69) if permanent
or small breadboard (Radio Shack 276 -175 $7.99) if temporary
Soldering iron if permanent
Reference:
Mims, Forrest M. Engineer’s Mini-Notebook
Science Projects (Radio Shack 276 -5018) 1990 Radio Shack pg.
45
Construction of electronic
cricket:
The circuit diagram is shown below with the corresponding
pins of the 555 IC chip labeled. The 555 IC chip will have a
diagram on the back of the package which specifically identifies
the number of each pin. Typically, there will be a small circle or
dot besides the #1 pin. The #1 through #4 pins are on one side of
the chip while #5 through #8 are on the opposite side. The 8½
speaker which is shown in the circuit diagram can be replaced by
the LED. The longer leg of the LED should be connected to the 10 ½
resistor while the shorter leg is connected to the #3 pin of the
555 IC chip.
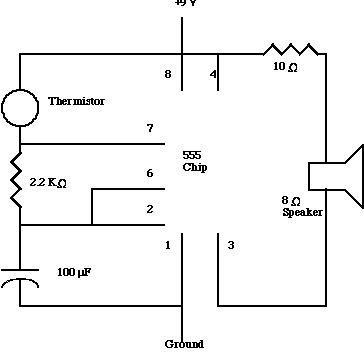
The thermistor should have extra long leads so that it can act as a
probe. The battery should be connect so that the + side goes the
point marked +9 V and the - side goes to ground. If the project is to
be permanent, then the use of an IC socket is advised as soldering
leads directly to the pins can damage the IC chip. The project can be
successfully set up on a breadboard.
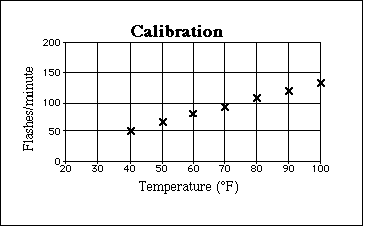
Once the project is wired and tested, it should be calibrated by
counting the flashed (or clicks) for one minute at various
temperatures. One method is to wrap the thermistor probe (and its
leads) in plastic wrap and put it in a cup of water with a regular
thermometer. The experimenter should wait at least two minutes for
thermistor to come to equilibrium before counting the number of
flashes. A simpler method is to an outdoor thermometer with the
apparatus left outside for some period of time. Taking readings over
the period of one day will usually give a 20-30° range on the
Fahrenheit scale. A typical calibration graph is shown below:
Calibration graph
Suggested experiments:
- The students should first calibrate the cricket over some
appropriate temperature range.
- The students should take equal volumes of hot and cold water
in Styrofoam cups. They should rapidly determine the flash count
for each cup and then combine the hot and cold water into one cup
and count the flash rate after stirring briefly. The simplest form
of this experiment is to have a cup one-third full of hot water
and another cup one-third full of cold water. Determine the count
for each cup ending in the cold water cup. Add the hot water to
the cold water cup and stir with a plastic coffee stirrer for
fifteen seconds.
- Then count the flash rate for the new volume of water. The new
count should be the average of the hod and cold counts.
- The experiment above can be repeated for different volumes of
hot and cold water (suggestion: use simple ratios like 2 cold to 1
hot). The students can develop a simple model for calorimetry.
The cricket can be used to monitor outside temperatures on a daily
basis as part of a weather program.
- Student experimenters should also examine the effect of
changing the 2.2 K½ resistor to some other value (such as 1 K½ or
4.7K½) on the flash rate of the LED. The students should also
change the capacitor (try 47 µF or 220 µF).
Back to the Teaching Ideas Page
Back to the Virginia Instructors of
Physics Home Page.
This page was posted on 2/26/99