 |
||||||||
|
Ghanta and Vajra – Tibetan prayer bell physics Presenter: Andy Jackson, Harrisonburg City Schools, ajackson@harrisonburg.k12.va.us. Va. SOL: PH.1 The student will plan and conduct investigations using experimental design and product design processes. Key concepts include
PH.2 The student will investigate and understand how to analyze and interpret data. Key concepts include
PH.8 The student will investigate and understand wave phenomena. Key concepts include
Topic/Concept Students will investigate the sound produced by a bell sounded three different ways, and interpret graphical and mathematical representations of the sound data with regard to the way their hearing discerns the differences. Materials
Alternative Materials List
Safety Considerations Do not strike the bell while holding close to someones ear. If you are using the glasses, do not hit them too hard so as to break them. Presentation This bell can be sounded by clapper, wooden striker, and resonance. The student uses the microphone and vernier software to record and analyze the three different sounds. How the physics is demonstrated This gives the student a chance to examine frequency, period, resonance, beats, wave superposition, and explore the ability of the human ear to discern slight differences in sound. Construction and Tips Regarding the Demonstration None Sources & References None
Ring the bell all three ways with essentially equal volume of sound. Listen carefully and describe the differences in sounds they produce. Do not pay attention to the initial moment of ringing, but of the sound created and sustained after initiation of the sound. Clapper
Wooden striker
Resonance
Do you hear one sound? Variations in sound?
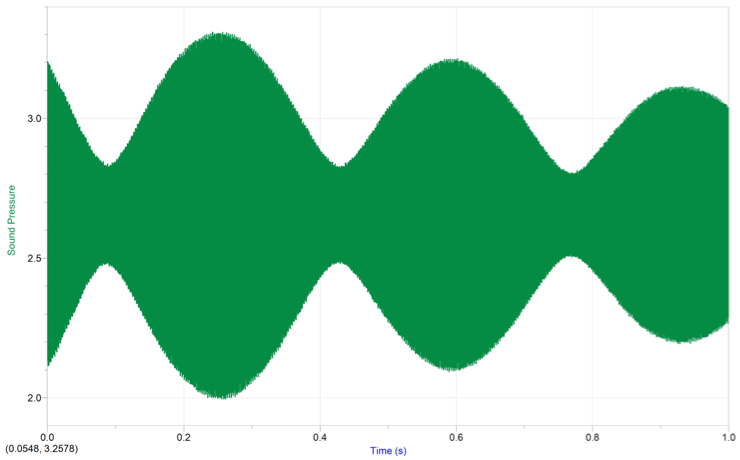
Use a microphone hooked up to the LabQuest2 to record the sound. Put the settings to record for 1.00 s at a rate of 10,000 points per second. Save each of the recorded sounds as a uniquely named file that makes sense so you know which file represents which way of ringing the bell. Examine each of the traces. Zoom in to see the fine details. What are you are seeing that connects to the sounds or the difference in sounds you noticed earlier?
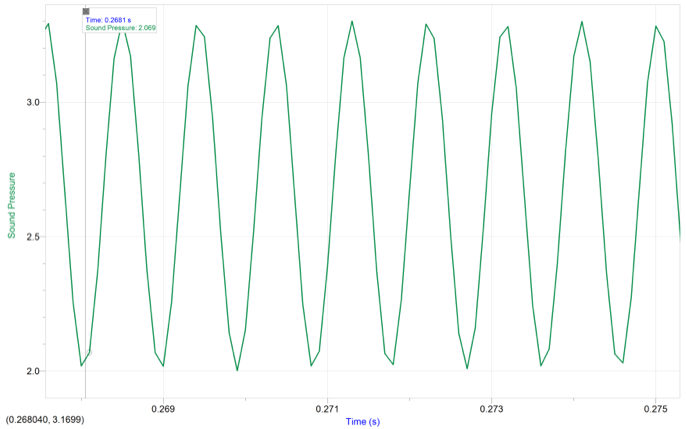
Zoom in to the “smoothest” of the sounds until you can see several wavelengths of the sound being made. Use the curve fit and choose “sine” to fit a function to the data. Take the value of B and divide it by 2π. This answer is the frequency of the wave. It is the frequency of the sound you were hearing. What is the frequency?
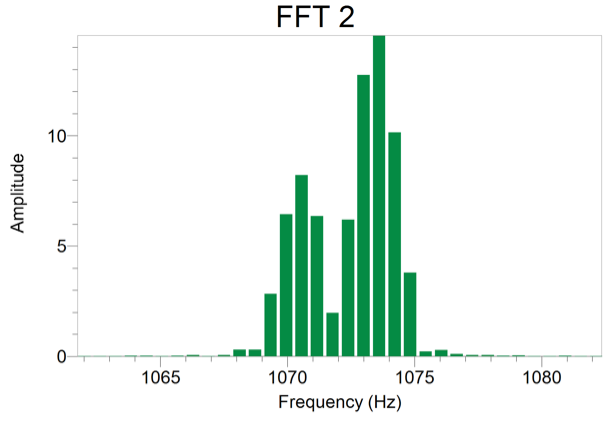
Apply a Fast Fourier Transform to the data. A Fast Fourier Transform (FFT) takes a complicated wave and breaks it into multiple simple sine waves that when added together make up the single complex pattern. The image will look something like this once you have zoomed into the dominant peak to examine things more closely. Use the examine tool to find the frequency of the two dominant frequencies (or frequency clusters)
|
 |
A special thanks to VASTfor hosting our web site. |
|